
Claude's New Products: Projects, Dashboards, and Motion Explained

Claude’s recent product updates include redesigned Projects, Dashboards, and Motion. The Projects beta was announced on September 17, followed by Dashboards and Motion on October 8. Together, these updates add ways to manage ongoing work, explore data, and explain ideas visually. Projects announcement, Dashboards and Motion announcement.
What each product does, and who can use it
| Product | Main purpose | Current availability |
|---|---|---|
| Redesigned Projects | Coordinate related tasks and parallel threads over time | Beta rolling out to selected Claude Code users on Pro and Max |
| Dashboards | Build dashboards from connected data sources | Beta on Pro, Max, Team, and Enterprise |
| Motion | Animate text, charts, and images into explainers | Beta on Team and Enterprise |
| Docs, Slides, and Design | Create documents, presentations, and designs | Out of beta, available on all plans, including Free |
See the Projects availability guide and Artifacts plan comparison. Enterprise access also depends on administrator settings.
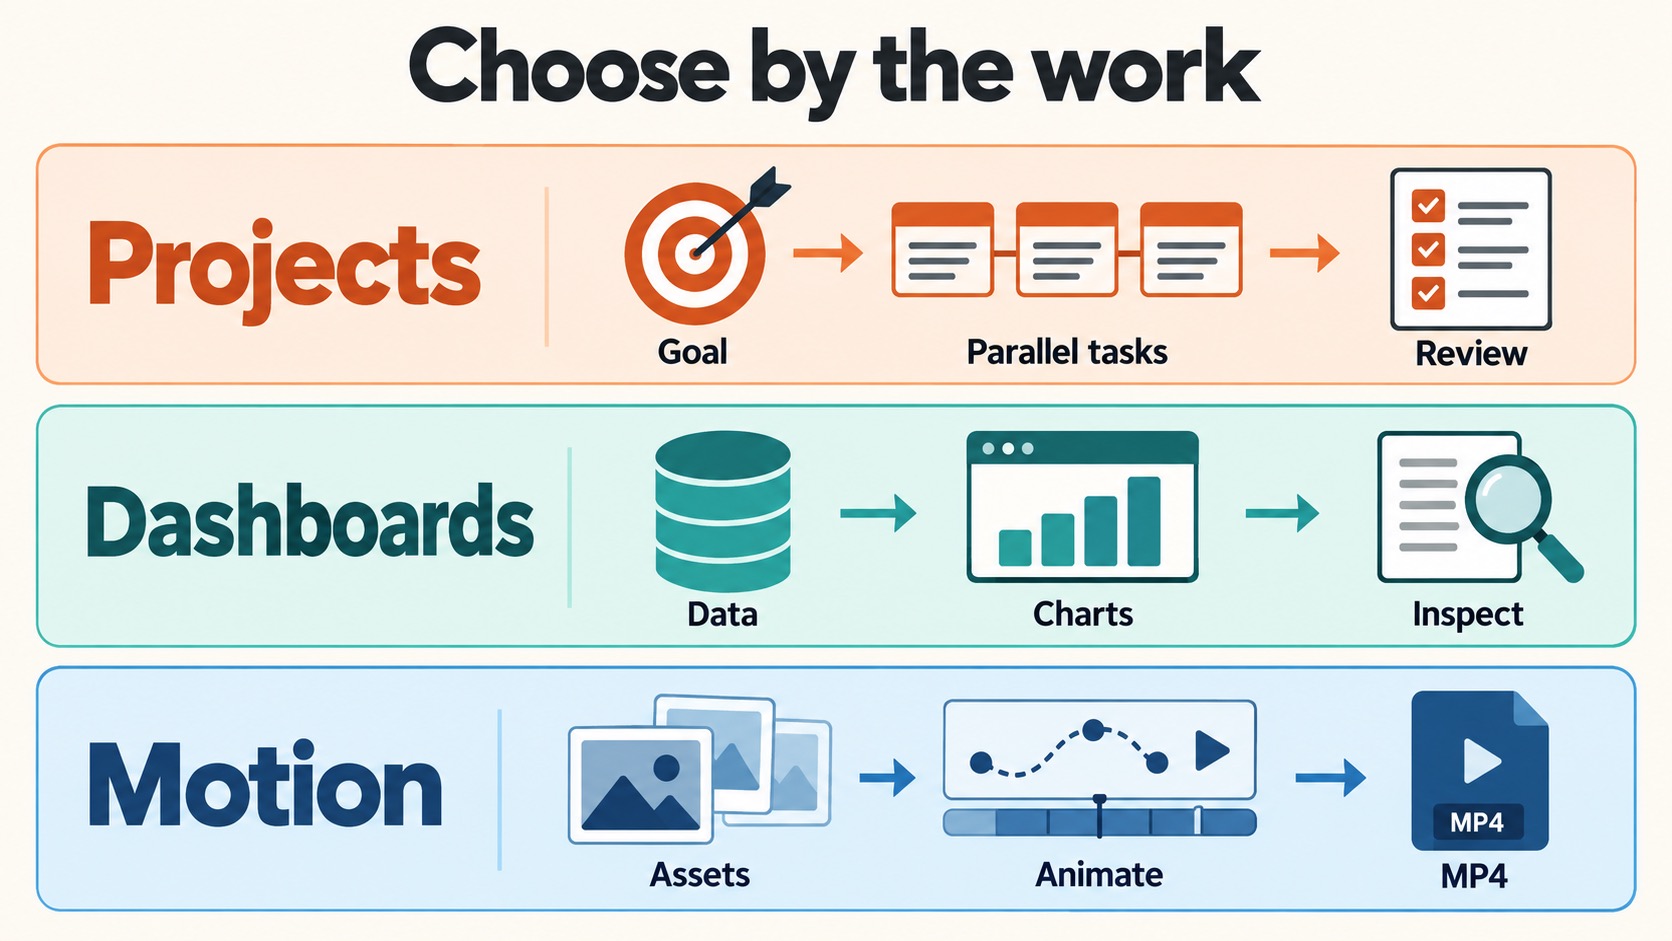
Figure 1. Choose by the work: Projects takes a goal through parallel tasks to review; Dashboards takes data through charts to inspection; Motion takes assets through animation to an MP4 export.
Projects: one place to keep related work moving
Existing Projects organize chats, knowledge files, and project instructions. The redesign adds coordination: you describe work in a central conversation, and Claude distributes tasks, coordinates progress, and assembles results. Cloud threads use shared project context and memory, while Library collects the files you add and the files they produce. Existing and redesigned Projects.
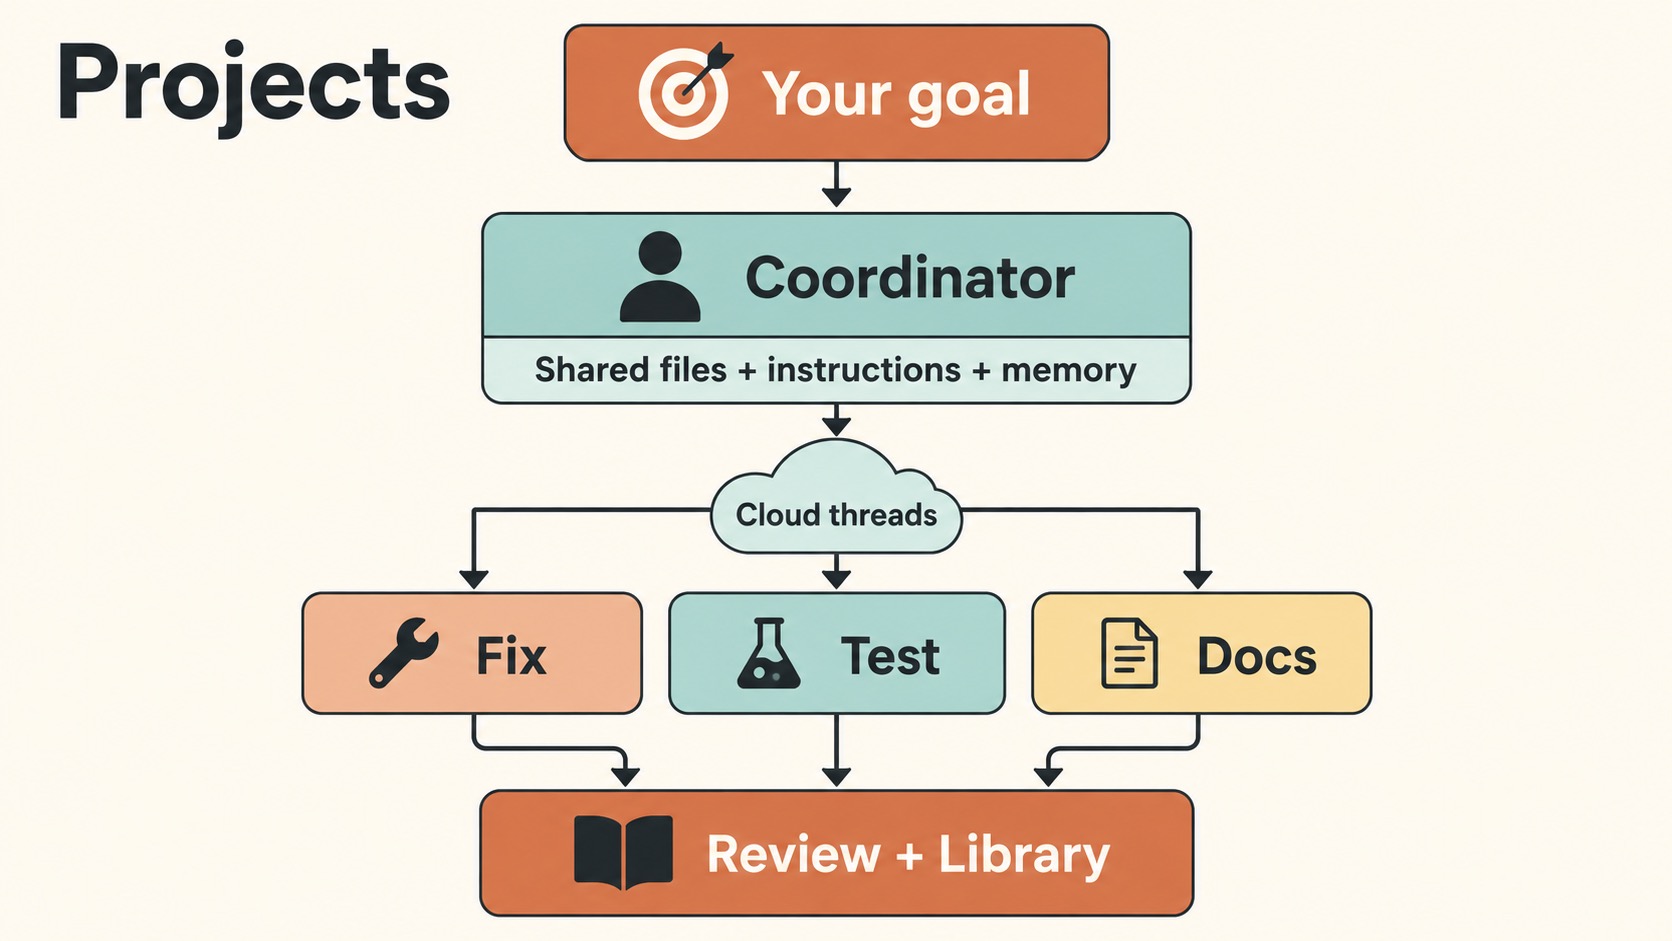
Figure 2. One possible game-release task split: the main conversation coordinates fixes, tests, and documentation. Cloud threads share project context, with results collected for review and in Library. The actual split depends on the task.
For an app or game developer, I would start with a release that involves several related tasks: fixing login, adding tests, and drafting release notes. The useful question is whether the project reduces repeated briefings and makes work awaiting review easier to find.
A first task could look like this:
The goal of this project is to improve a new player’s first session. Identify the two most confusing steps in the tutorial, propose improvements, and add tests. Explain your task split first. Deliver code changes as reviewable PRs and leave merging to me.
If the rollout has reached your account, start in claude.ai/code → Projects or the desktop app’s Code tab. Add the repositories and files the work needs. Cloud coding tasks require the appropriate GitHub access; your local tools and configuration are not automatically inherited. Setup guide.
Cloud threads can continue after you close your laptop. Threads running on your computer need it awake and connected. Parallel edits can still create merge conflicts, and multiple sessions consume your plan allowance faster. I would begin with one or two small tasks, inspect the results and usage, then widen the scope. Cloud and local execution, parallel work and usage.
Having the existing chat Projects interface does not establish access to the redesign. The beta is still rolling out, and Team and Enterprise do not have it yet. Existing Projects continue to work. Current availability.
Dashboards: make the numbers inspectable
Claude Dashboards connects to platforms such as BigQuery and Snowflake, as well as apps such as Salesforce. Ask a question in natural language and Claude builds charts with inspectable queries and data refresh timestamps. Dashboards guide.
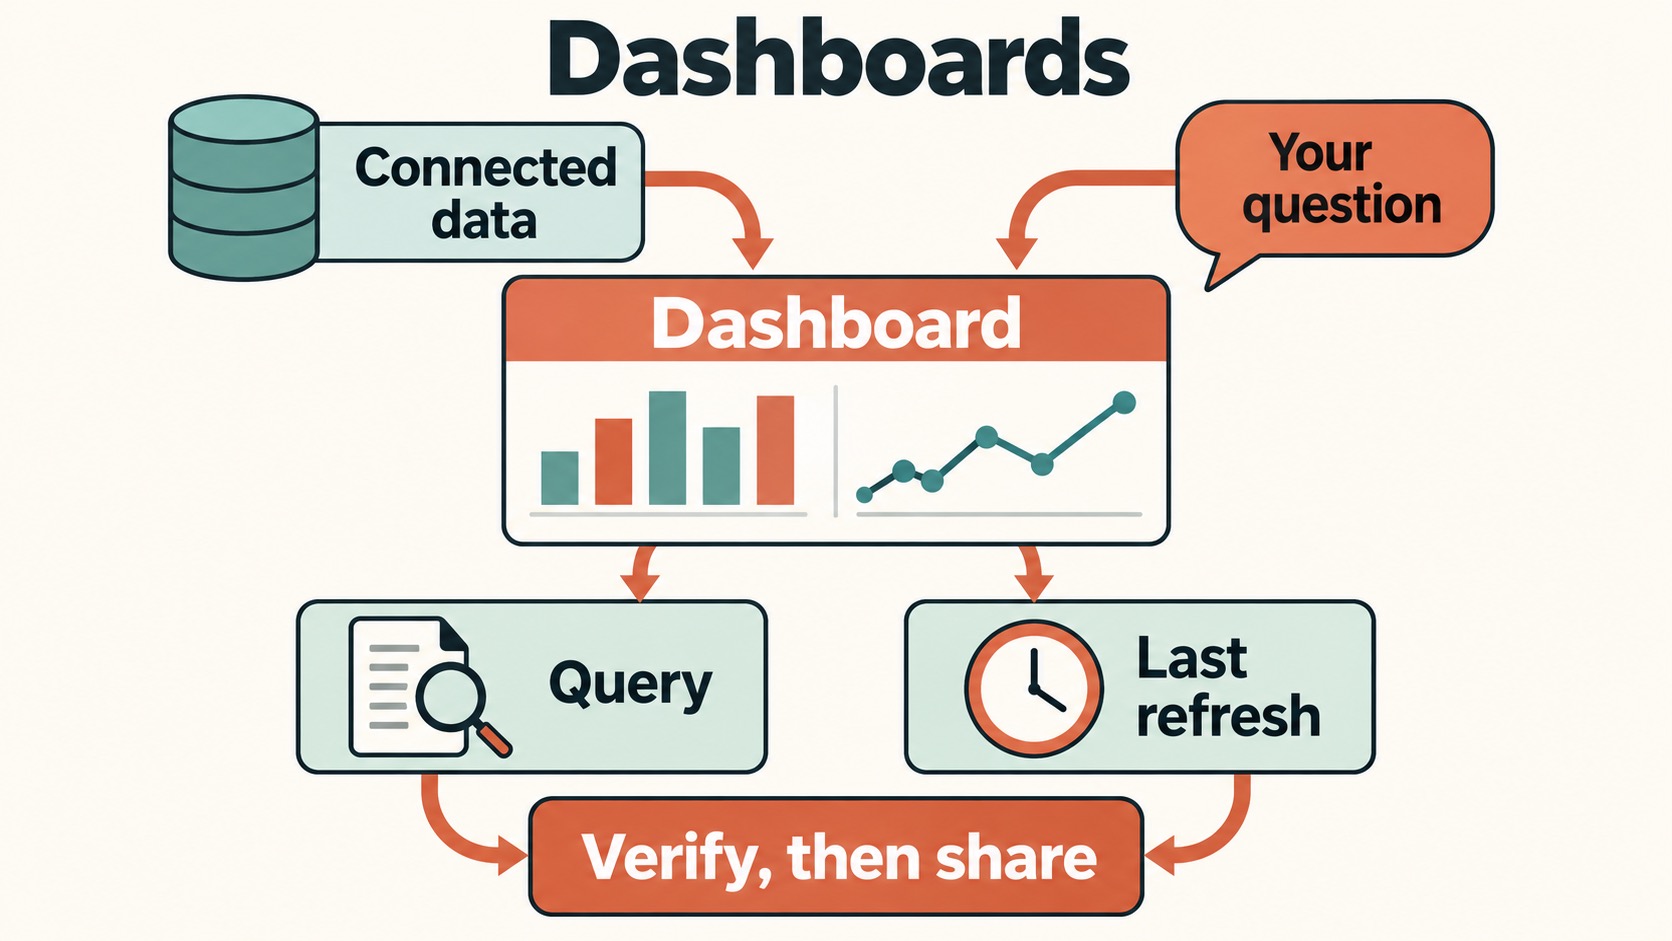
Figure 3. Data and a question produce a dashboard. Inspect its query and last refresh time, then verify the metric definitions before sharing. The charts shown are conceptual illustrations.
For product work, start with a question you can check. “Which subscription plan drove last month’s growth?” gives you a clearer test than “Make a nice dashboard.”
Using the connected subscription data, compare new paid users and cancellations by plan over the last eight weeks. State the date fields, time zone, and metric definitions, then build weekly trend charts.
A polished chart still needs a sound definition. Refund treatment and whether cancellations count at request time or subscription expiry can change the interpretation. I would reconcile one known week before relying on the dashboard in a regular report.
Anthropic positions Dashboards for quick exploration, with deeper work continuing in other analytics tools. Connectors inherit source-service access permissions, so available data still depends on authorization. Intended use, connector permissions.
Motion: explain a feature with editable animation
Claude Motion makes short explainers, product walkthroughs, and animated charts. It animates text, shapes, and images through code, allowing changes to content and timing. It does not generate realistic footage or people. Motion guide.
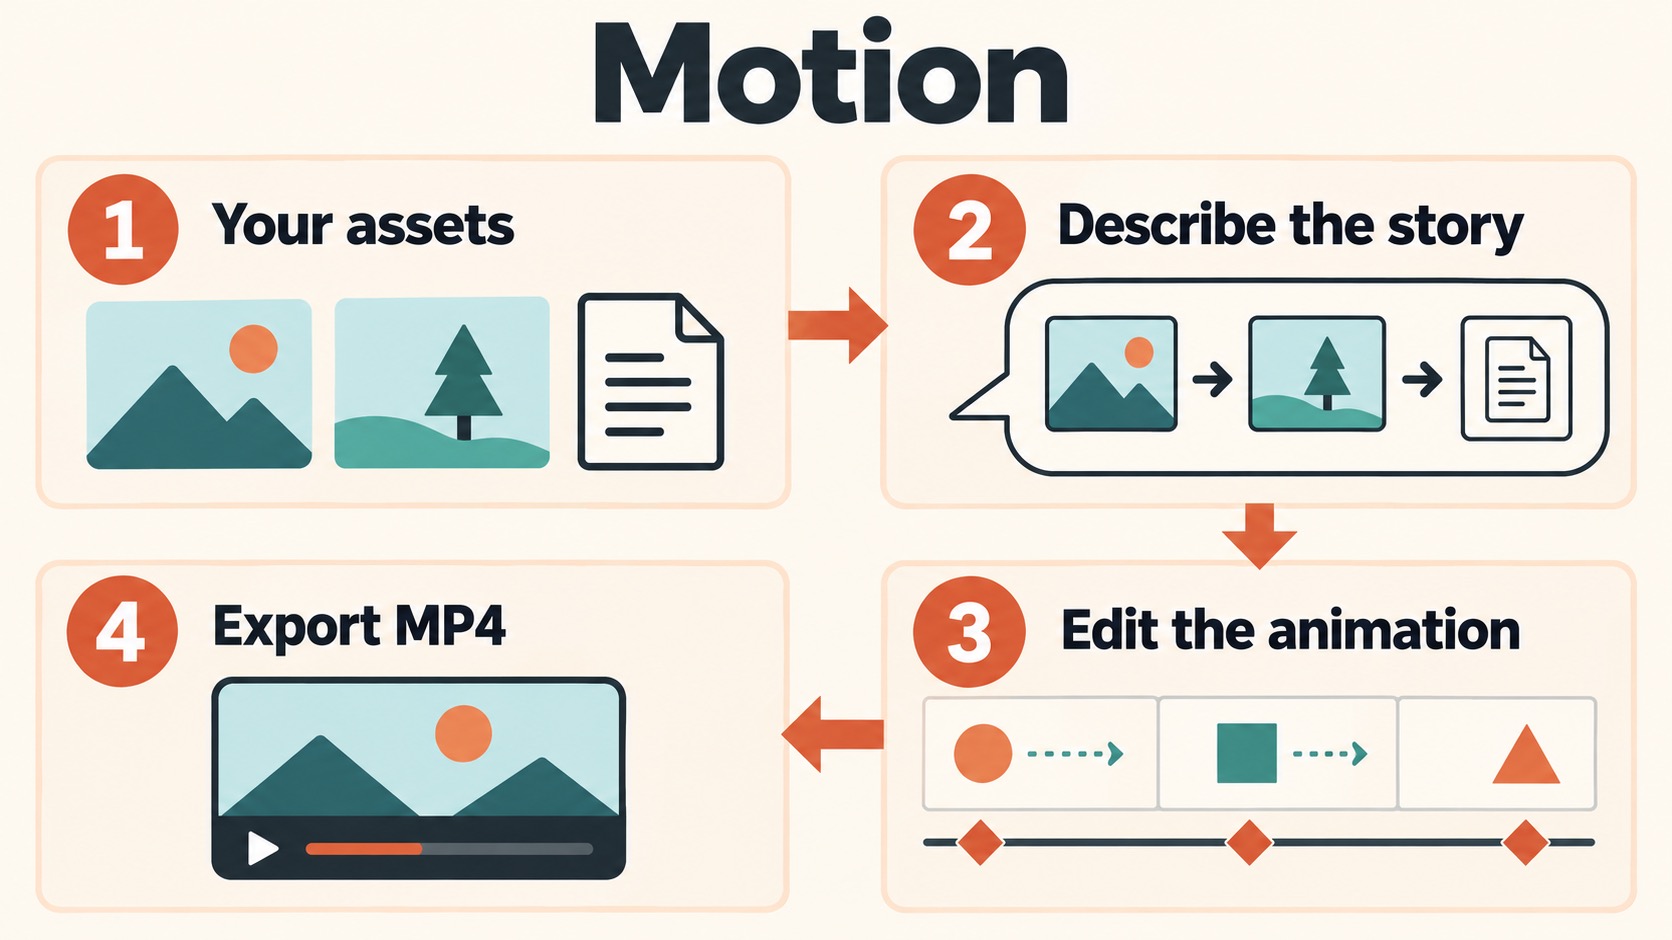
Figure 4. Supply assets, describe the story, edit the animation, then export MP4. Naming the audience and intended duration helps you refine the content and pacing.
For a first try, start with a five-second animation using simple shapes. This prompt uses only a ball and a ripple, so the resulting video can be shared across language versions:
Use Motion to create a minimalist five-second animation in 16:9. Use a dark blue background and one light blue ball.
0–3 seconds: Move the ball from the left to the center with one gentle bounce.
3–5 seconds: Keep the ball in the center while a circular ripple expands outward and fades.Use only simple geometric shapes, with no text, subtitles, logos, or audio. Generate one version, exactly five seconds long.
A five-second Motion animation example. Press play to watch.
Start through Output → Motion in the message box, or choose a Motion template in Artifacts. You can adjust the result through chat or the editor and export it as MP4. Creation and export, editing artifacts.
Motion draws on your existing plan limits, with longer or more complex animations using more. A short first segment makes it easier to check accuracy and pacing before expanding the piece. Motion usage.
What changed for Docs, Slides, and Design
The October 8 announcement also takes Docs, Slides, and Design out of beta and onto every plan. On Enterprise, these templates turn on by default on October 15. Dashboards and Motion remain off by default there; owners enable them in Organization settings → Artifacts. Announcement, administrator guide.
Existing Design users have another date to track: the standalone claude.ai/design site closes on December 14, 2026. Design-system migration is available now. Projects remain on the standalone site for the moment, with migration details still to come. Chats and comments will not carry over, and standalone public project links will stop working, so save anything you need beforehand. Design migration guide.
Choose a first task you already understand
- An ongoing development goal keeps producing tasks: try redesigned Projects and inspect coordination, review quality, and usage.
- You need to understand a change in product metrics: try Dashboards with one clearly defined metric.
- Players or colleagues need a quick feature explanation: Team and Enterprise users can try Motion.
As an independent developer, I would first evaluate whether Projects keeps related tasks aligned when requirements change, and whether its output is easy to review. For Dashboards and Motion, an existing weekly report or product explanation gives you a familiar baseline for judging the time saved.
For a broader comparison of coding tools, see Claude Code, Codex, and Cursor: which fits your work?.


