
Stop Guessing LLMs: The Definitive Guide to Artificial Analysis for Balancing Quality, Latency, and Cost

During AI developer keynotes, radar charts and cherry-picked bar graphs are everywhere. Whether a model claims to beat competitors on an academic benchmark or boasts a 5x speed boost, engineers and product managers know the reality: vendor-reported scores are often measured under curated conditions that rarely match day-to-day API performance in production.
If you are evaluating large language models (LLMs) and trying to find the sweet spot between reasoning depth, response speed, and infrastructure budget, you need an unbiased, standardized source: Artificial Analysis, the industry’s most reputable independent benchmarking platform.
This guide breaks down how to navigate the platform’s core metrics, read the Pareto frontier, and match the right model to your specific production workload.
Why Artificial Analysis Is Essential for LLM Selection
In the past, model evaluation relied heavily on Hugging Face leaderboards or community blind tests (Chatbot Arena). However, as AI applications mature into production systems, raw answer accuracy is only part of the equation. Developers care equally about: Under standardized hardware, how fast does the model generate tokens? What is the Time to First Token (TTFT)? How much does a complete task actually cost on the monthly invoice?
Artificial Analysis operates an independent benchmarking environment, regularly testing proprietary models (OpenAI, Anthropic, Google) and open-source weights (Meta Llama, DeepSeek, Qwen) under standardized scripts:
- Independent and Objective Benchmarking: Tests run in a unified, automated testing harness with zero vendor sponsorship bias.
- Multi-Dimensional Metrics in One Dashboard: Tracks intelligence quality, generation speed, first-token latency, true price per task, and context windows simultaneously.
- Dynamic Pareto Frontiers: Visualizes which models define the boundary of peak cost-to-performance efficiency.
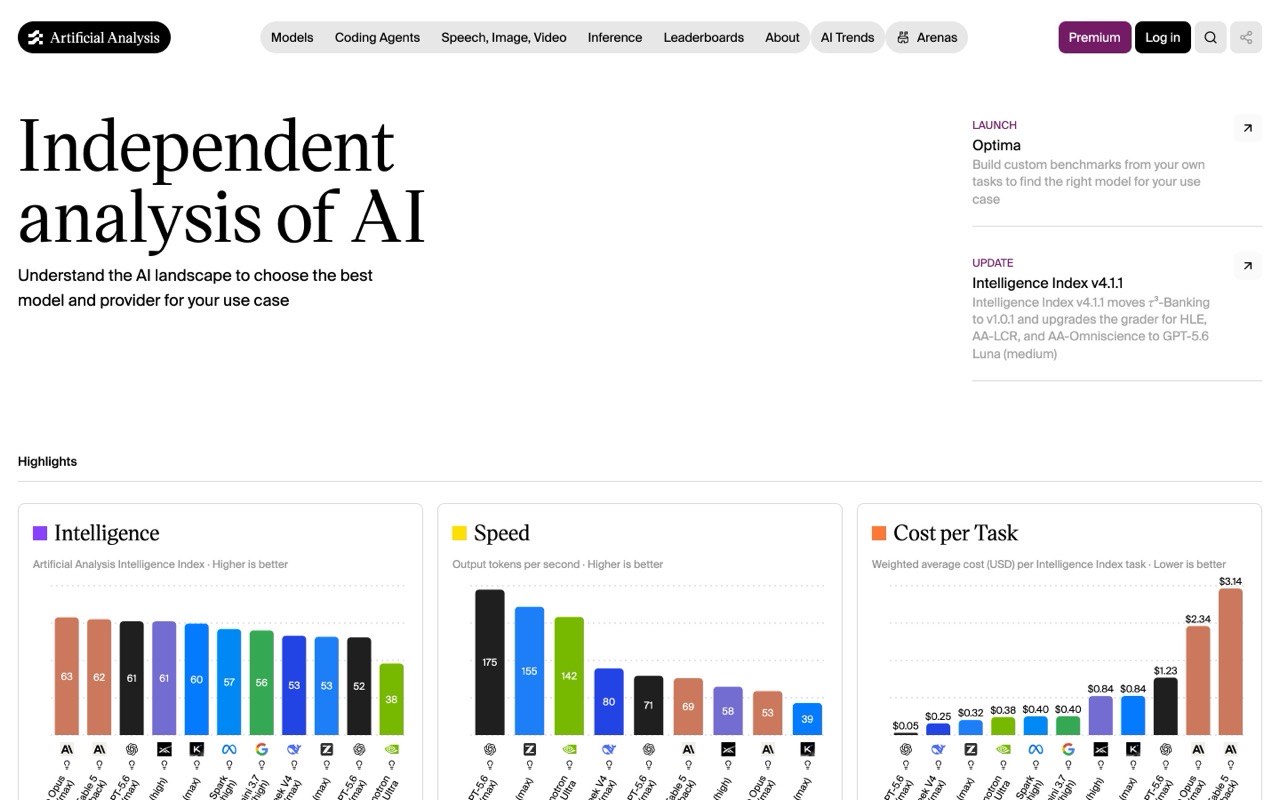
The Three Golden Dimensions Demystified
When landing on Artificial Analysis, three core indicators represent the foundational pillars of model evaluation:
1. Intelligence Index: How Smart Is the Model?
The Intelligence Index is a weighted composite score designed to assess real-world capabilities across complex reasoning (e.g., GPQA Diamond), terminal tool usage (Terminal-Bench), coding, and long-context comprehension.
- Higher Is Better: Reflects overall performance on programming, logical deduction, and complex prompt following.
- Lightbulb Icon: Denotes models equipped with explicit deep reasoning / Chain-of-Thought capabilities.
2. Speed and Latency: How Fast Does It Respond?
Response speed directly dictates end-user UX. The platform tracks two critical metrics:
- Tokens per Second (Throughput): Measures generative speed. 60–80 Tokens/s matches human silent reading speed; 150+ Tokens/s delivers instantaneous text streams ideal for autocomplete and interactive voice bots.
- Time to First Token (TTFT): Measures the latency between submitting a prompt and receiving the very first token. High TTFT makes applications feel sluggish or frozen.
3. Cost per Task: What Is the True Operational Bill?
многие developers look only at nominal list prices ($/1M tokens), which often undercounts the actual invoice. Modern reasoning models generate extensive internal thinking tokens before producing an answer—tokens billed on your API account even if hidden from UI output.
- Cost per Task: Calculates the true dollar cost of executing standardized end-to-end tasks across models, providing an accurate baseline for budgeting.
4 Practical Scenarios for Model Selection
Here is how to navigate the platform’s visual charts for four common deployment scenarios:
Scenario 1: High-Volume Production APIs—Reading the Pareto Frontier
If you run high-volume customer support bots or batch document pipelines, toggle to the Intelligence Index vs. Cost per Task scatter plot under the Cost tab.
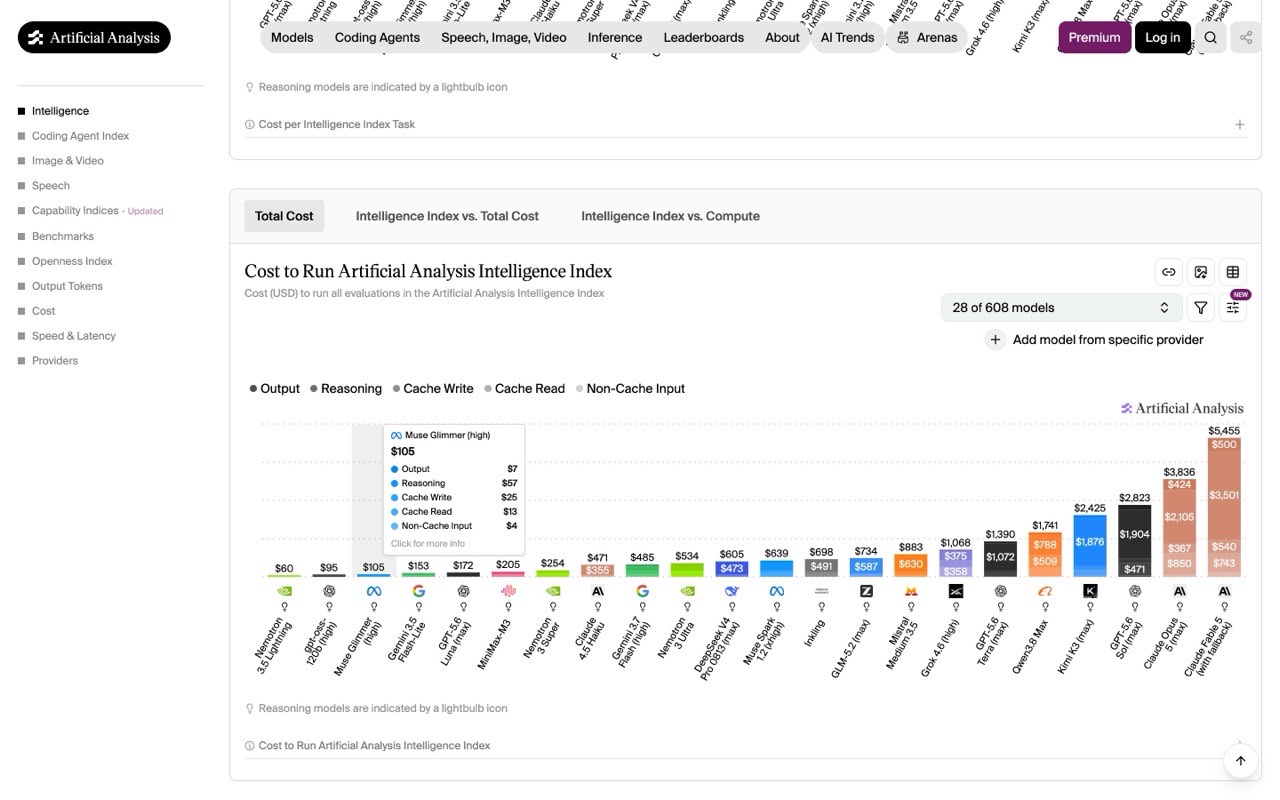
- Y-Axis: Model intelligence (higher is smarter).
- X-Axis: Cost per task (left is cheaper).
- Upper-Left Green Quadrant: The ideal “smart and affordable” zone.
- Pareto Frontier Line: The dashed line connecting models that offer the highest intelligence for a given cost, or the lowest cost for a given intelligence level.
Selection Rule:
- On the Pareto Line: Models on this boundary represent the absolute best value in their respective price tiers.
- Below / Right of the Line: Models far from the frontier are dominated by alternatives that are both smarter and cheaper.
Scenario 2: Real-Time Voice & IDE Autocomplete—Speed and Latency First
For inline code completion or conversational voice agents, any delay over 1 second degrades user experience.
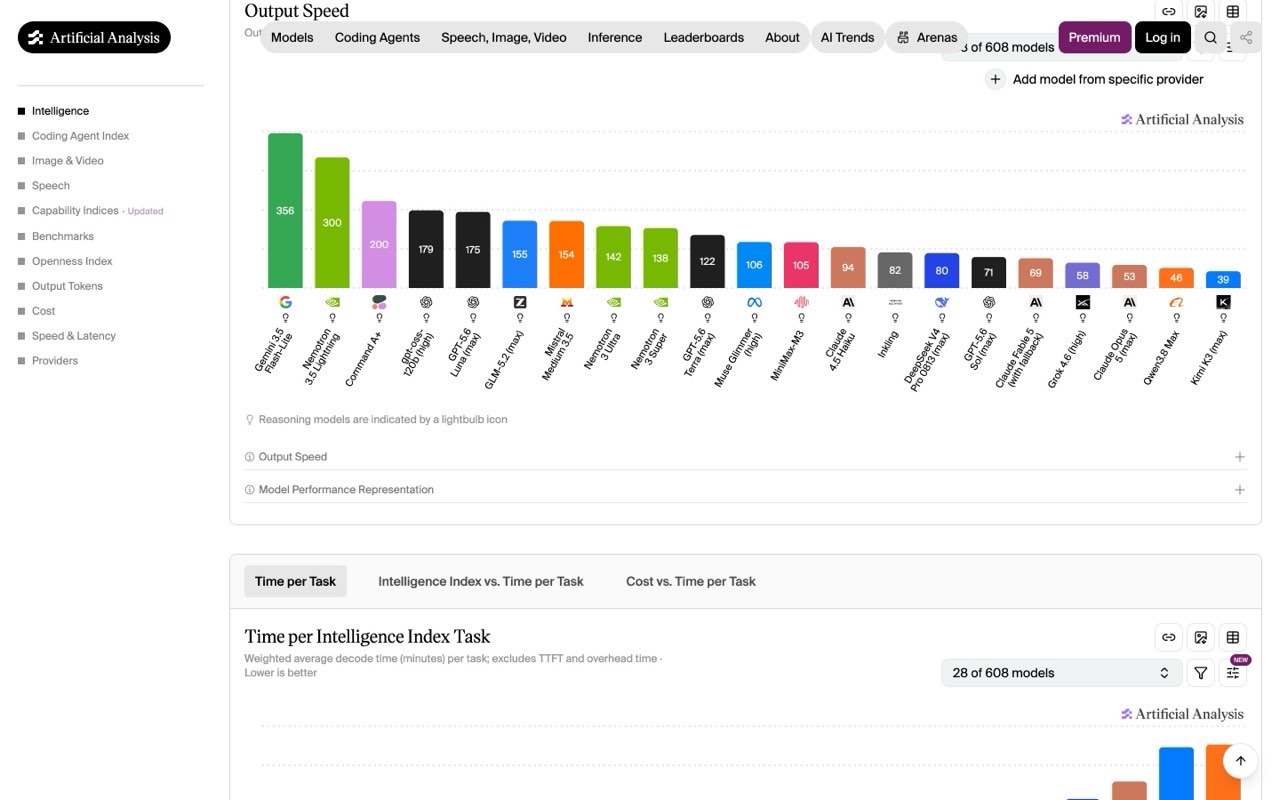
Categorize models by throughput:
- Ultra-Fast Tier (>140 Tokens/s): Instant streaming for inline code completion and real-time agents.
- Balanced Tier (60–100 Tokens/s): Smooth text delivery for web chats and document generation.
- Deep Thinking Tier (<50 Tokens/s): Reserved for offline batch tasks, complex planning, and non-blocking audits.
Scenario 3: Software Engineers—The Coding Agent Leaderboard
For pairing with tools like Claude Code or Codex, consult the Coding Agent Benchmarks tab.
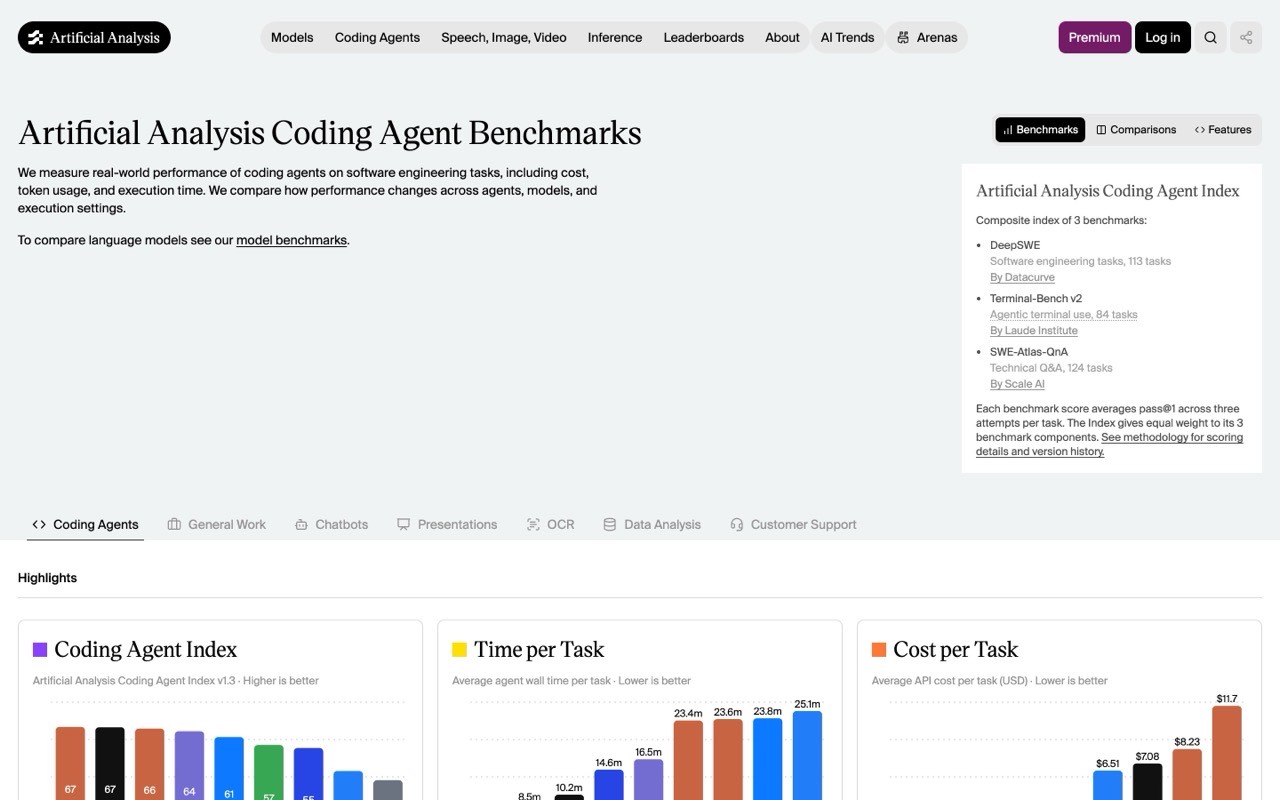
This evaluation tests three critical capabilities:
- DeepSWE: Evaluates fixing 113 complex, real-world GitHub issues end-to-end.
- Terminal-Bench v2: Measures shell proficiency, package installation, and environment management.
- SWE-Atlas-QnA: Evaluates multi-file architectural understanding across large repos.
Key Tip: Always balance solve rate against Time per Task and Cost per Task. An agent with a 2% higher solve rate that takes 25 minutes and $10 per task may be far less practical than one solving tasks in 8 minutes for $1.50.
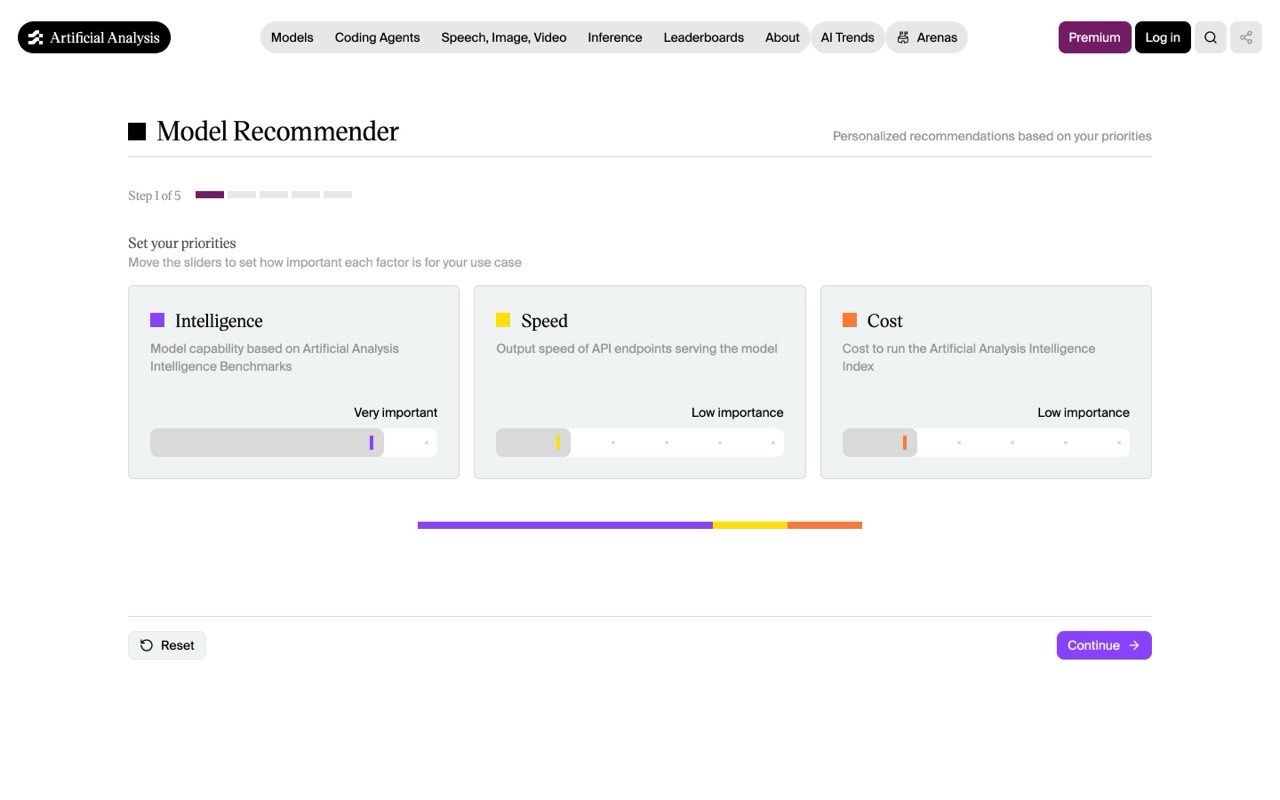
Scenario 4: The Model Recommender Tool
If you need tailored guidance, the interactive Model Recommender allows you to input priority weights (e.g., 50% Quality, 30% Cost, 20% Speed) to generate a personalized ranking.
Conclusion: Data-Driven AI Architecture
In an era of hyper-competitive model releases, relying on marketing claims leads to inflated API bills or degraded user experiences.
Using Artificial Analysis allows engineering teams to make disciplined, data-driven decisions:
- Choose Pareto-optimal models for high-volume pipelines.
- Choose low-TTFT, high-throughput models for interactive user surfaces.
- Deploy reasoning models selectively where complex multi-step planning justifies the cost.


